The ability to accurately interpret topographic maps is a foundational skill for successful navigation and route finding. These maps allow you to quickly locate your position, estimate your travel time, and problem solve if you get off-course. While GPS (Global Positioning System) devices are becoming increasingly accessible and reliable, solid map reading skills will always play an integral part in successful navigation.
To start things off, let's discuss exactly what defines a topographic map. Topographic maps (topo for short) are a type of planimetric map, a map as observed perpendicular to the ground, like a birds-eye view. Planimetric maps contain symbols, roads, rivers, and other distinguishable landmarks but lack any way to determine elevation. Topo maps add contour lines as a means to visually represent terrain (more on that later).
In this article, we are going to discuss what is commonly found on a topo map and explain how to see terrain features.
First, let's take a look at what is available on the outside margins of a topo map.
What you will find on the Map Margins
The Top
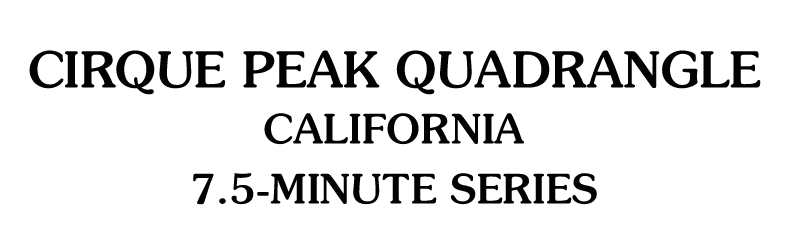
Starting at the top right corner of the map, you will notice the map's name and its series. Maps are named after prominent peaks, rivers, or valleys found within their series. This is an easy way to determine whether you have the correct map.
The series of a map determines how many minutes it covers. Minutes, in this case, are a measurement of distance (in latitude or longitude) instead of time, where 60 minutes make up one degree. The most commonly used topo map covers 7.5 minutes, which equals 1/8th a degree of latitude and longitude. These maps are called the 7.5 Minute Series.
Latitude lines are called parallels, which helps us remember that they are parallel to the equator. One degree of latitude always equals 69 miles because latitude lines are all parallel to one another.
Lines of longitude are called meridians. These lines run through both the North and South Poles, creating pie shaped wedges. Because meridians are not parallel to one another, the distance in one degree is not a constant. At the equator, one degree of longitude equals 67 miles, but at the poles one degree has no distance at all.
So a 7.5 Minutes Map will always cover roughly 8.5 miles of latitude (North to South) but a varying amount in longitude (East to West).
The Bottom
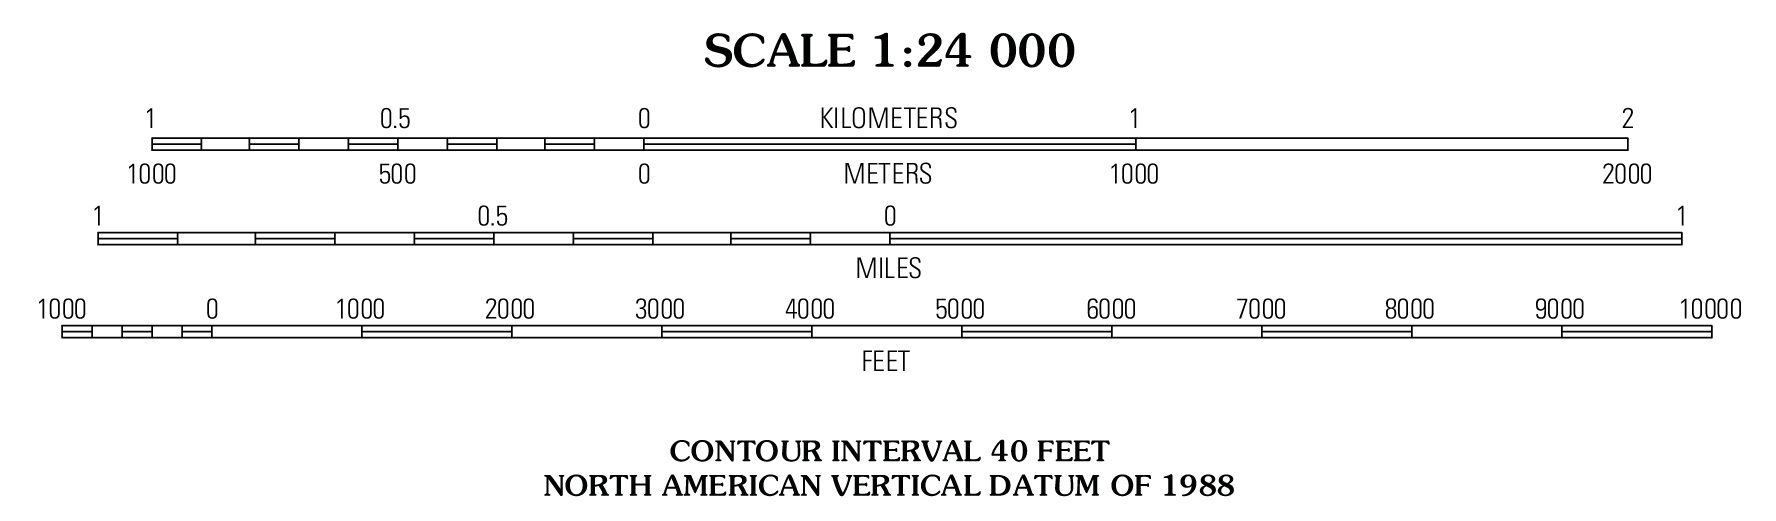
On the bottom center of the map you will find the scale. A written scale is accompanied by a graphic scale: a visual representation of the distance of a mile or kilometer on that particular map.
A map's scale determines how close up things are and is different from its series. A 7.5 minute map, without its scale, could be printed on an index card or the side of a building and still be accurate because it covers a specific area. Luckily, the USGS has established a convention that 7.5 minute maps will be printed in a 1:24,000 scale for imperial units, and a 1:25,000 scale for metric units.
Below the scale is written the map's contour interval. We will talk more about contours in just a bit.
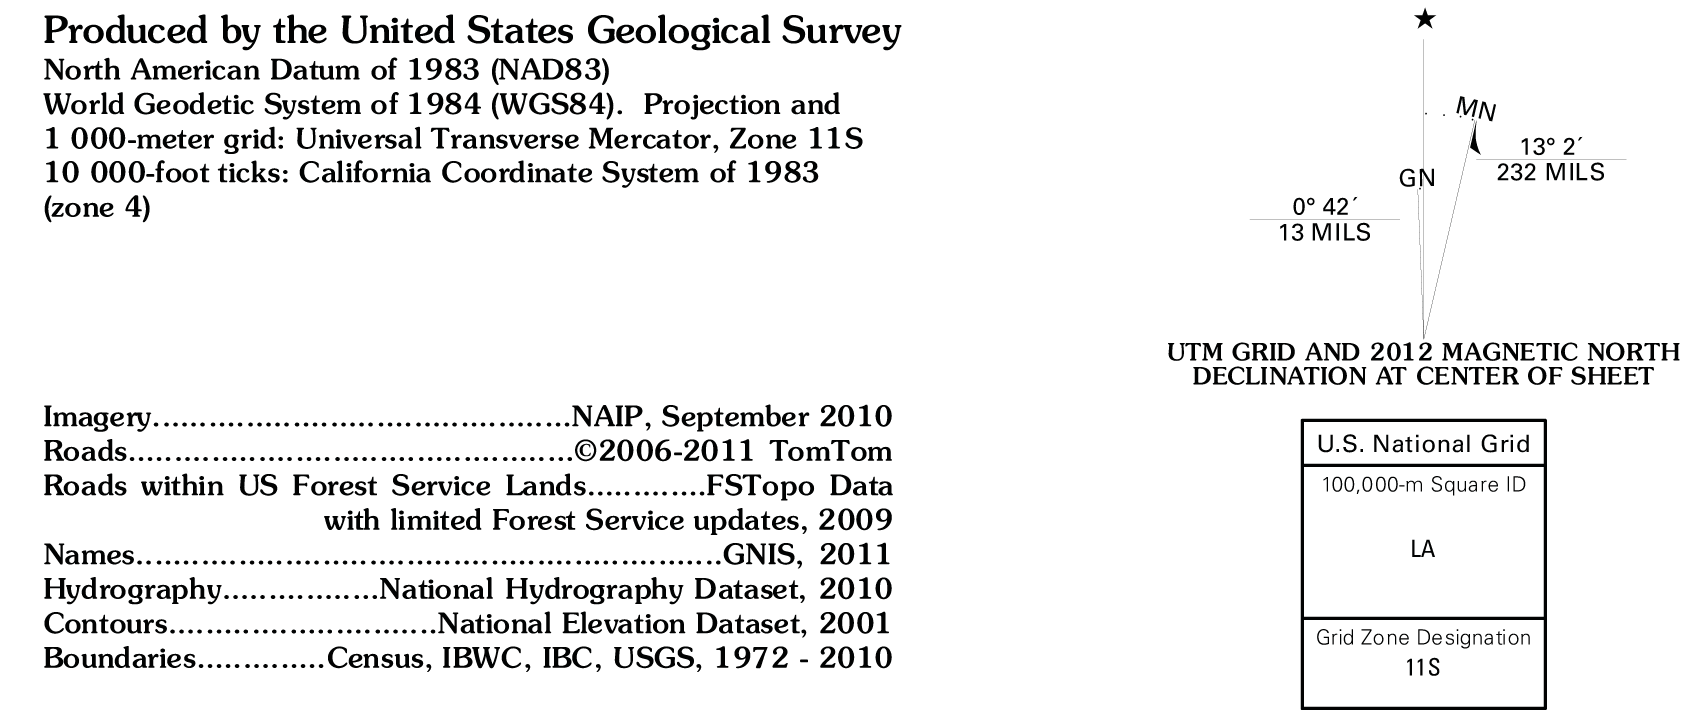
The bottom left of the map gives you copyright and printing information. A good thing to check is when the map was last updated, because older maps are less accurate. You will also see a graphic for magnetic declination, which we will cover in a later article.
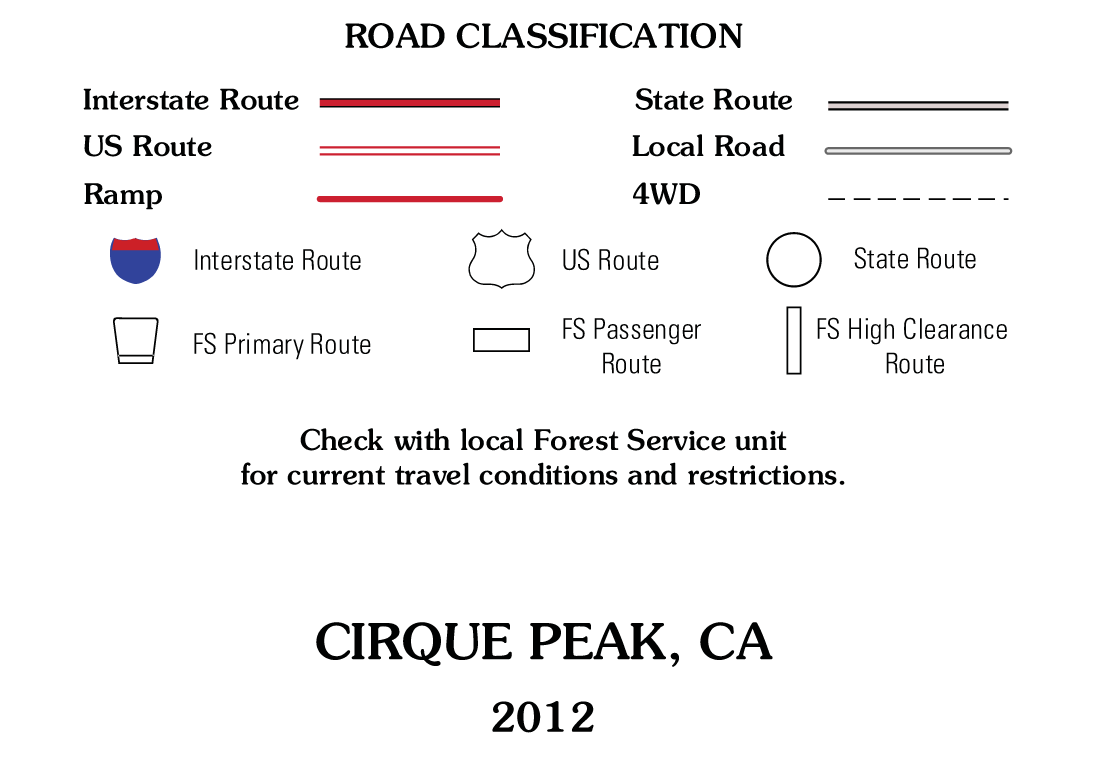
The bottom right has the map key. The key provides useful information such as the size of roads, maintenance of trails, agency borders, and much more. What is available on the key depends on that specific map.
Understanding Colors
Let's take a second to discuss USGS's color conventions before we start talking in-depth about specific map features. All USGS maps follow specific patterns of color. This is great because it makes map reading consistent whether you are in Alaska, Florida, or anywhere in between.
Black means man-made objects. These can be roads, trails, or buildings. Black is also used to label named landmarks, such as peaks or meadows.
Brown indicates contour lines and elevation markers along index contours.
Blue shows bodies of water. Oceans, rivers, lakes, marshes, and/or snowfields.
Red deliniates land boundaries, such as townships, National Parks, etc. Red also designates major highways.
Green portrays areas of vegetation. Dense trees are marked as a darker green, and sparse alpine vegetation is a lighter green.
With those colors in mind, let's take a look at specific contour features and symbols commonly found on topo maps.
Loving this? Sign up and get the latest goods delivered right to your inbox.
The Beauty of the Contour Line
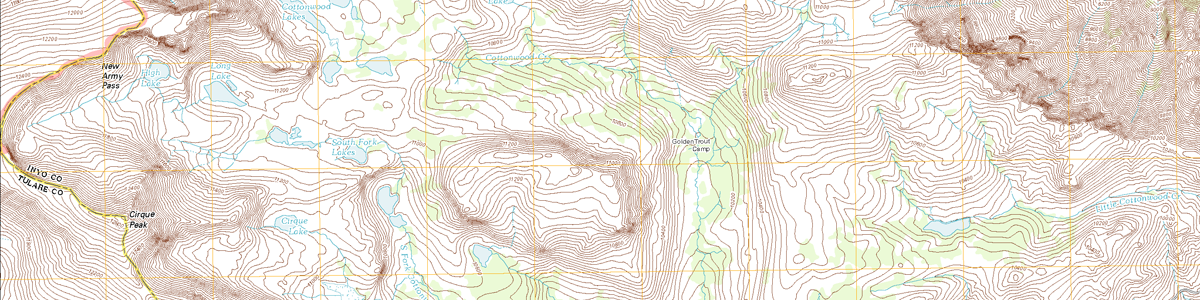
The most notable aspect of a topographic map is all the squiggly brown lines. These lines are called contour lines and they make a topographic map their unique subset of planimetric map.
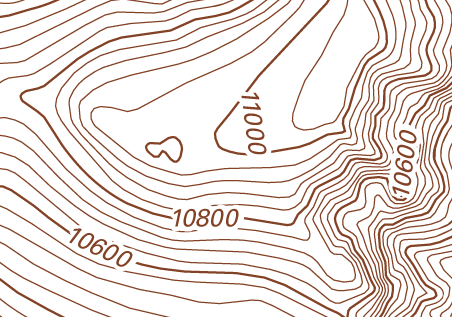
There are two types of contour lines, intermediate and index. Intermediate contour lines are the thin brown lines which show the map's elevation. Index contour lines are a thicker brown line located every 5th intermediate. These lines give us specific elevation markers and provide a more manageable visual guide.
The white space, representing the elevation change between two contours, is called the contour interval. Contour intervals are different depending on how much elevation a map has. In North Dakota a map's contour may be 5 feet, but in Alaska it might be 100 or more feet.
Think of each contour line as a step. Each map's steps (contour intervals) are a consistent height. In the following graphic we match up index contour lines with their relative height. Then a estimate profile of the ridgeline can be drawn.
Breaking Contour down into Terrain Features
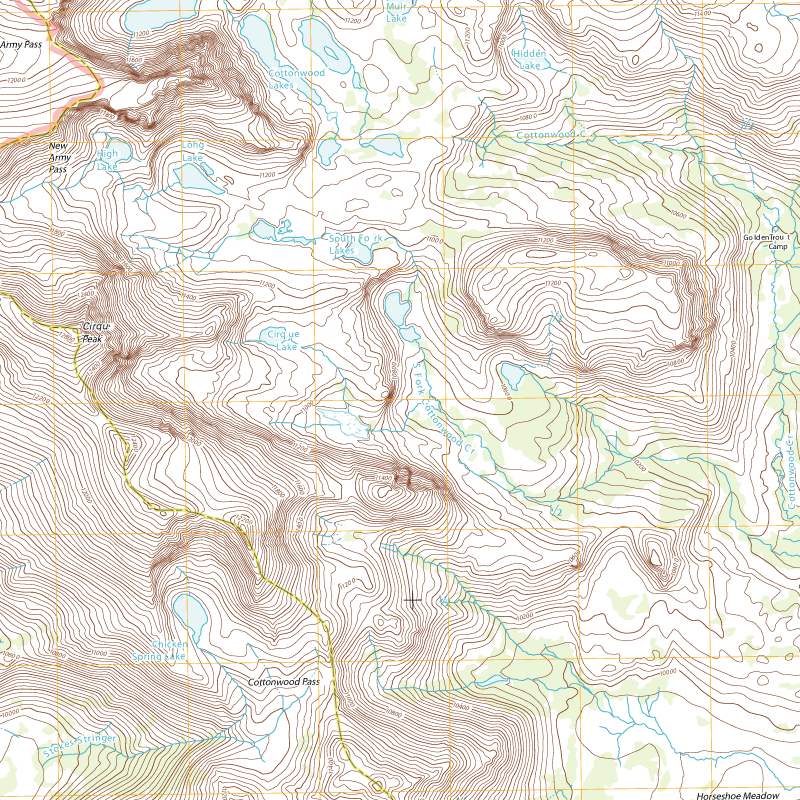
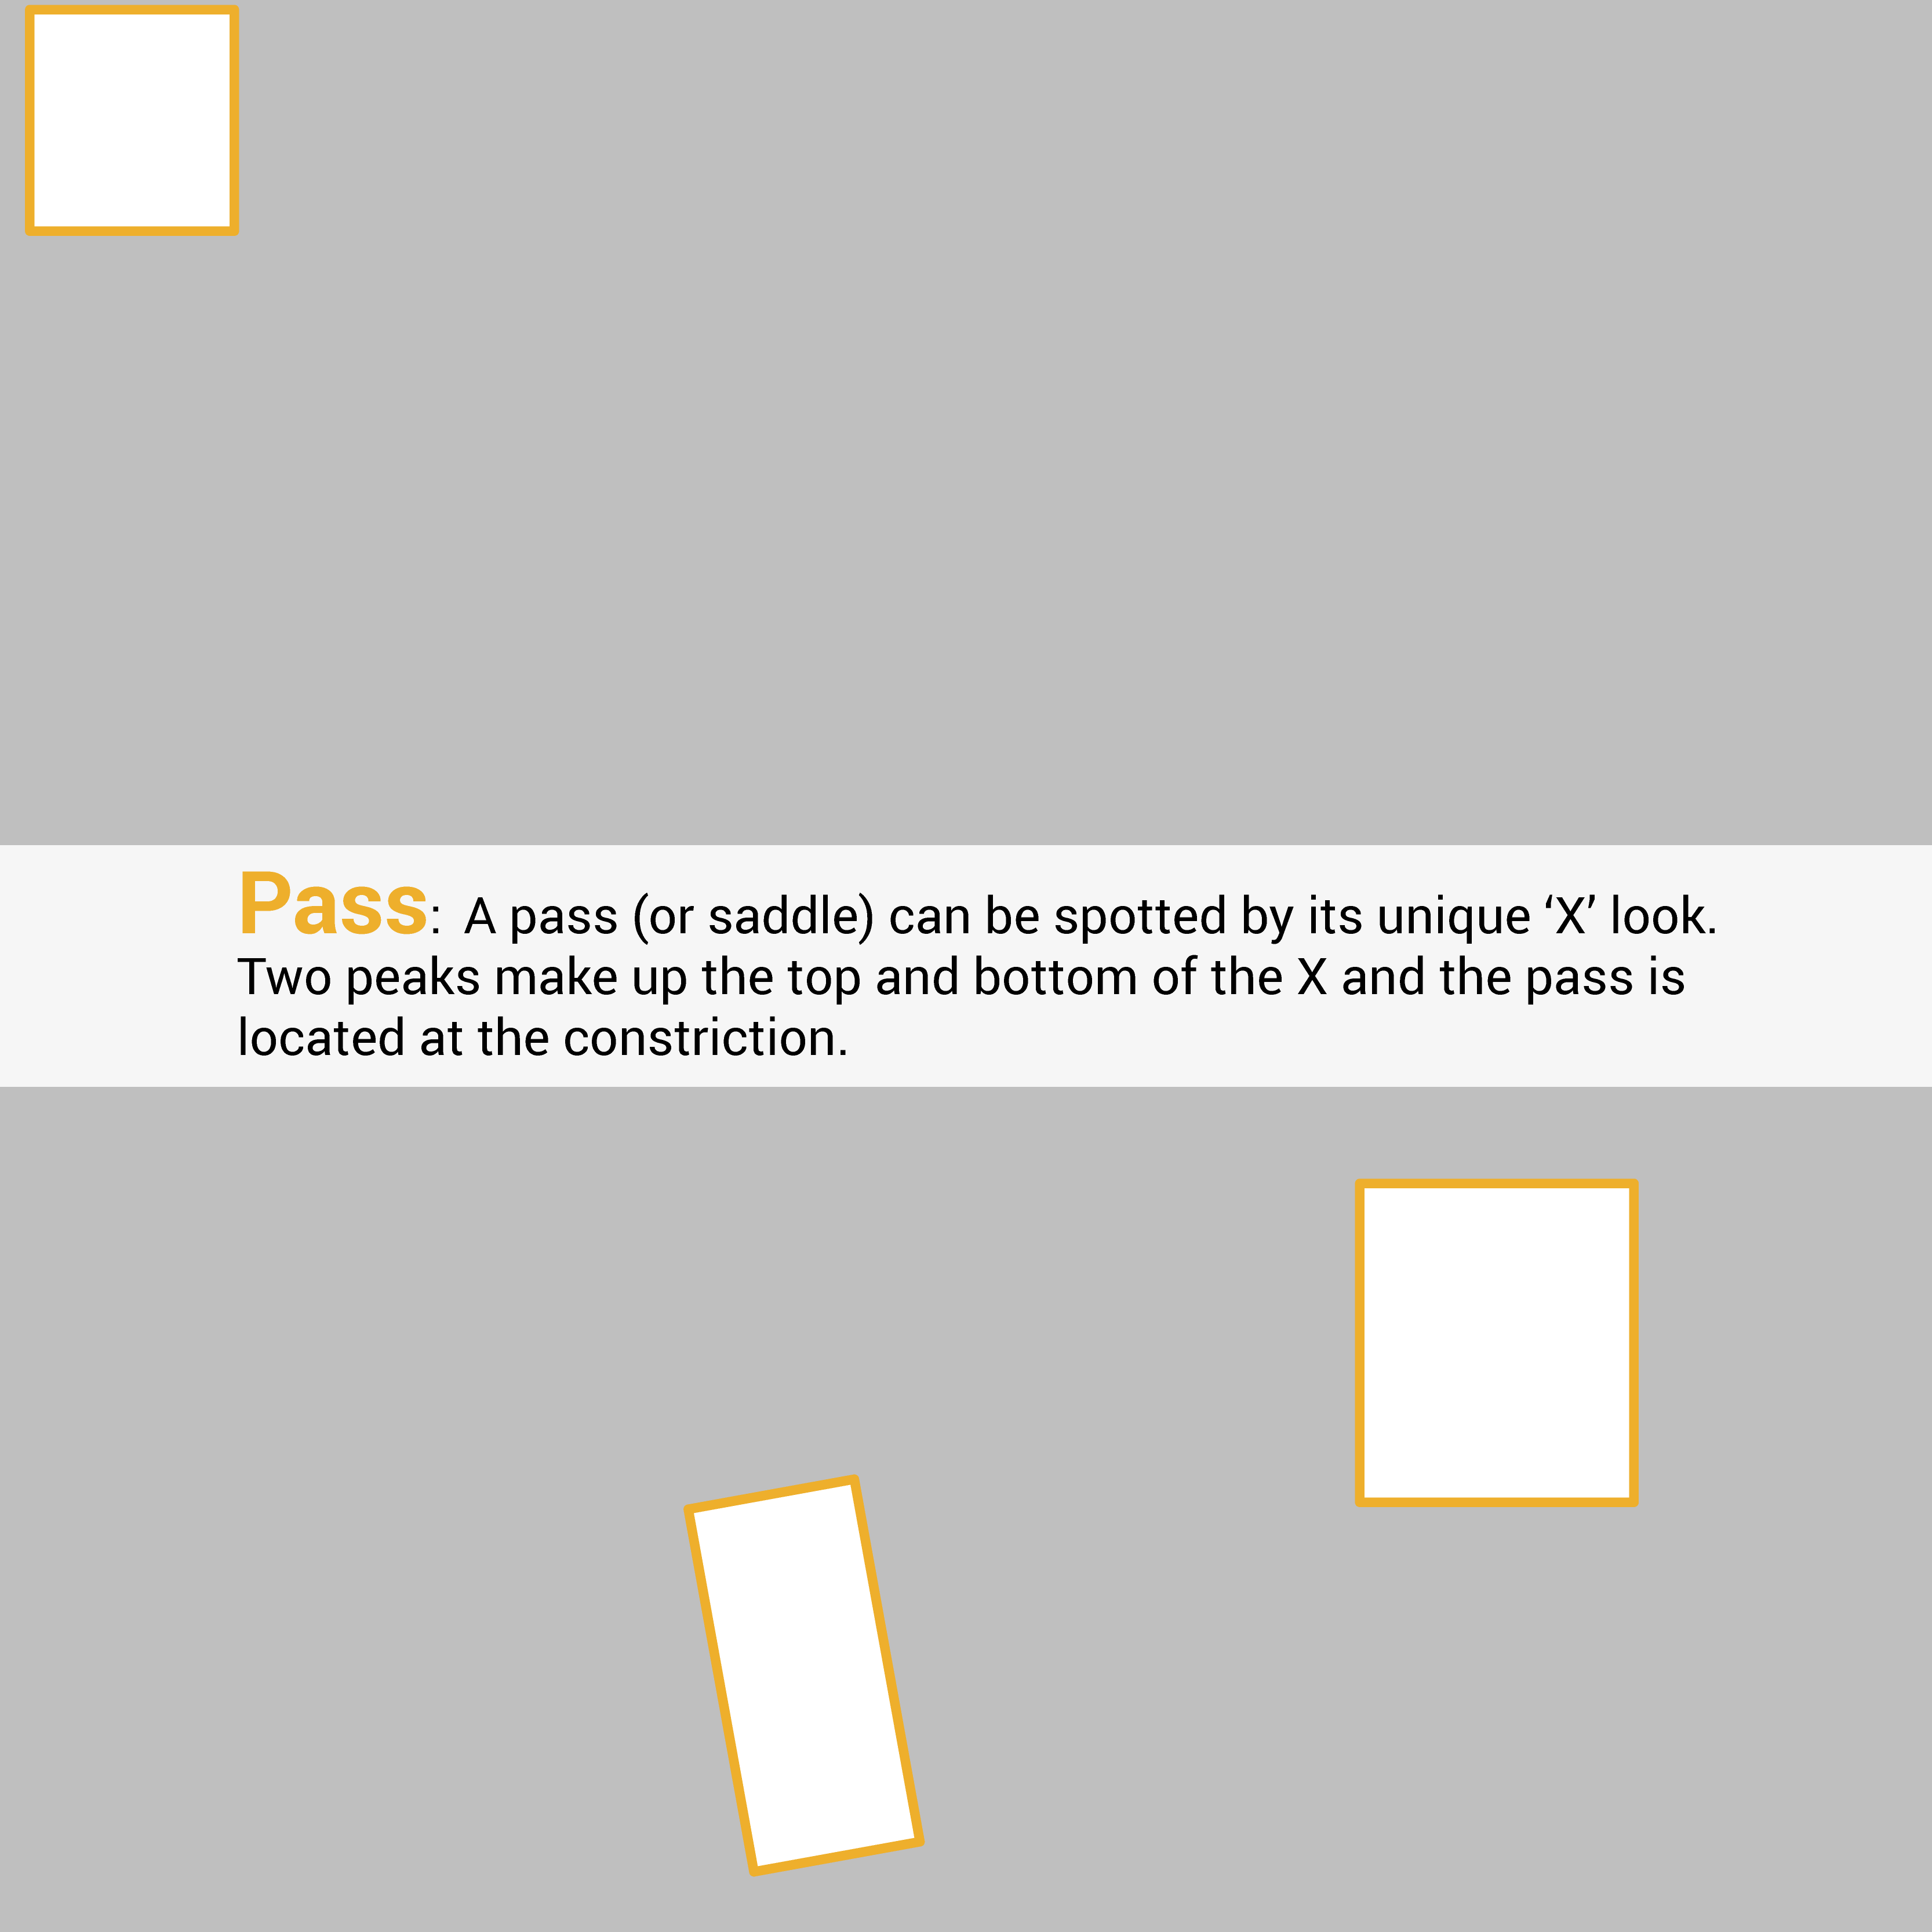
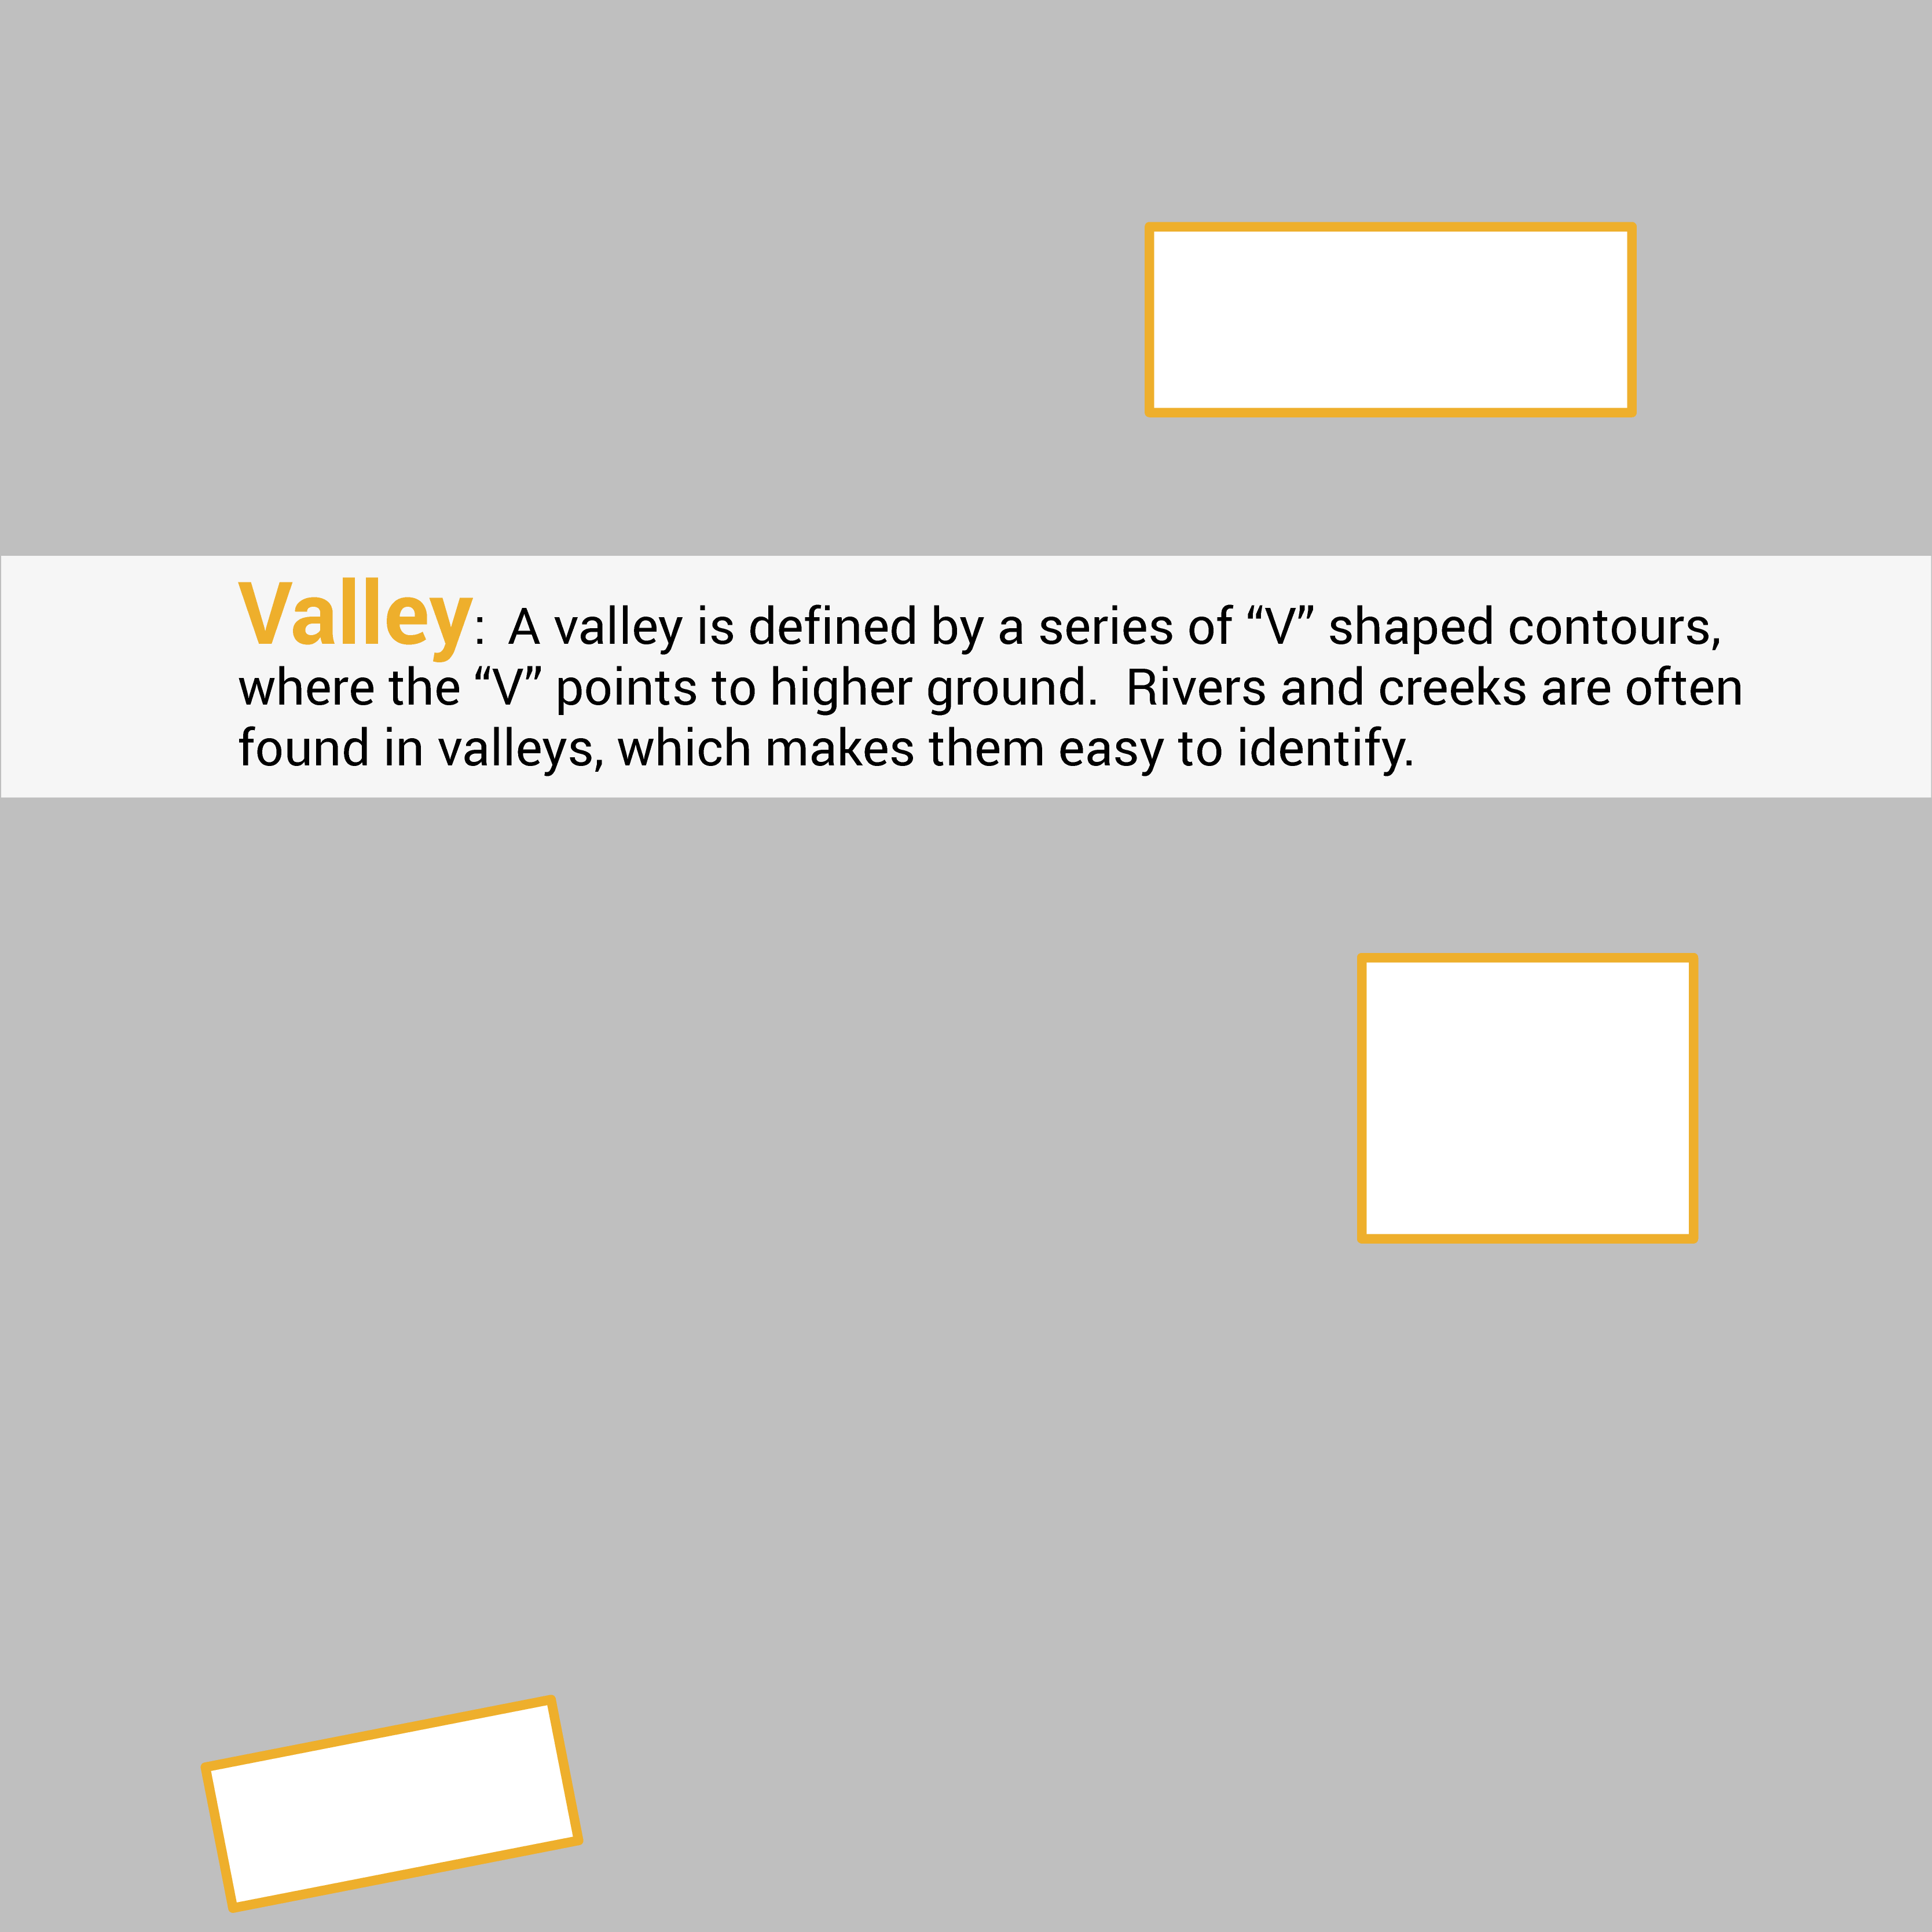
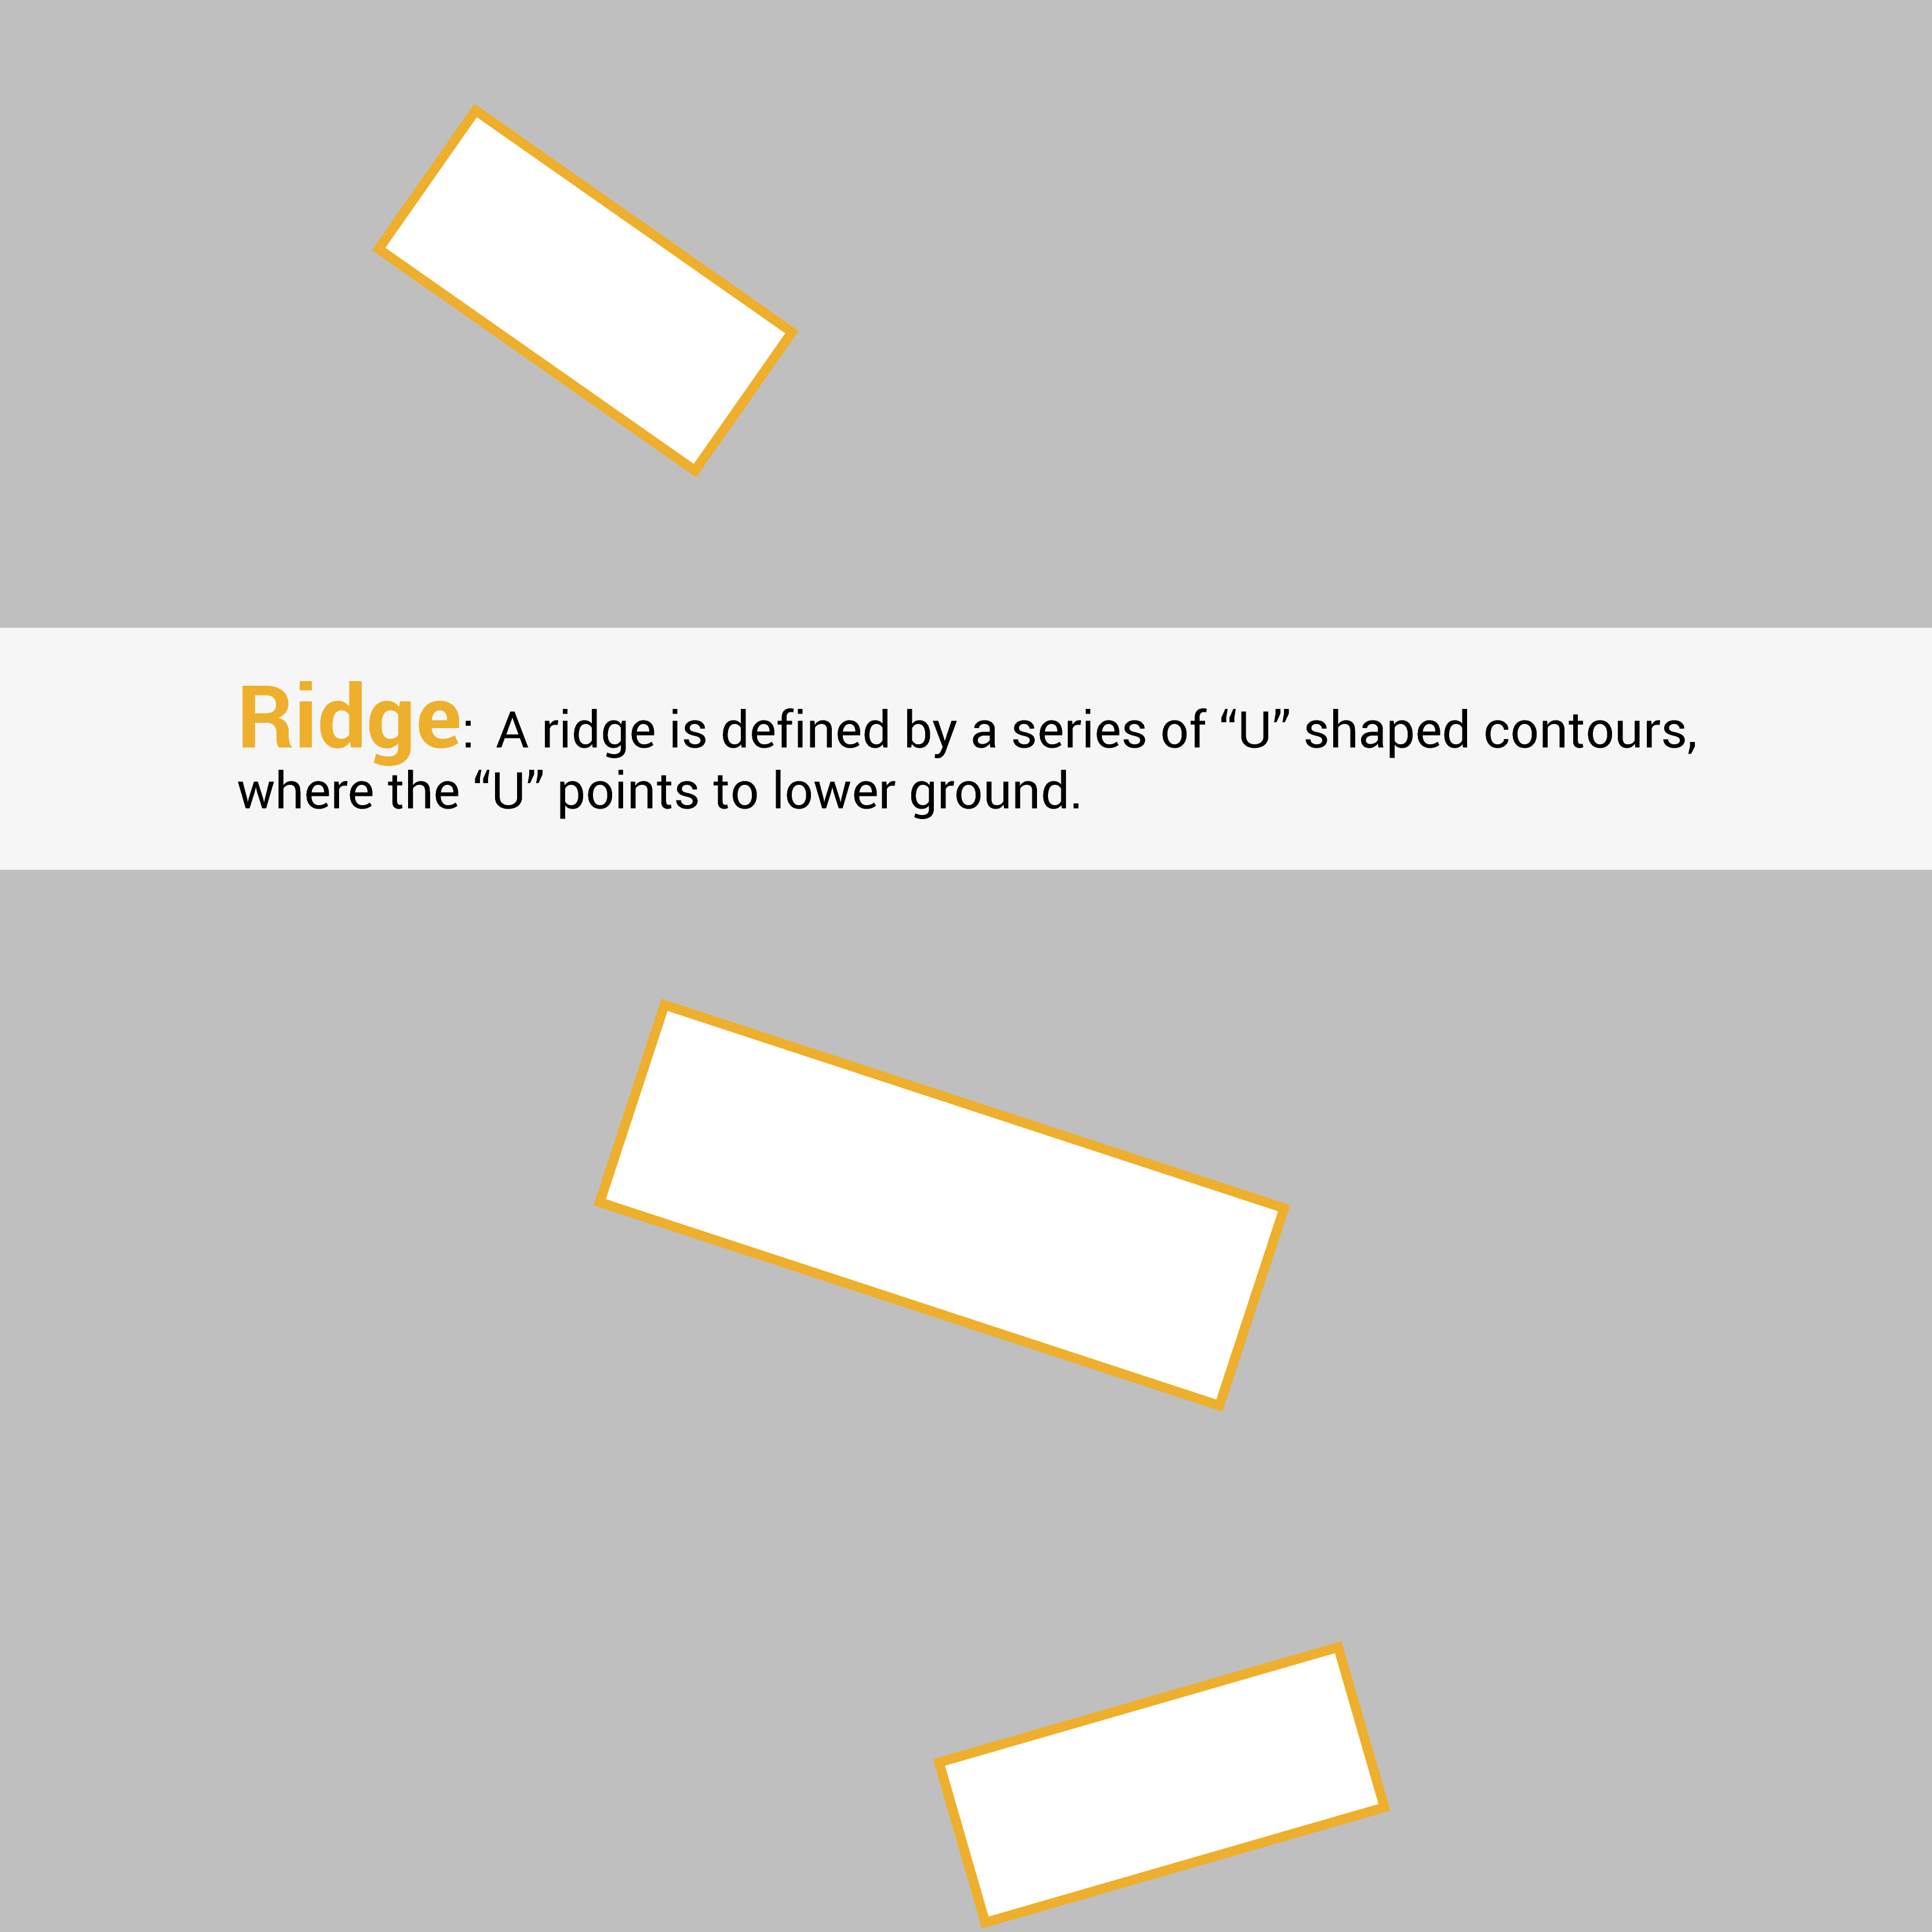
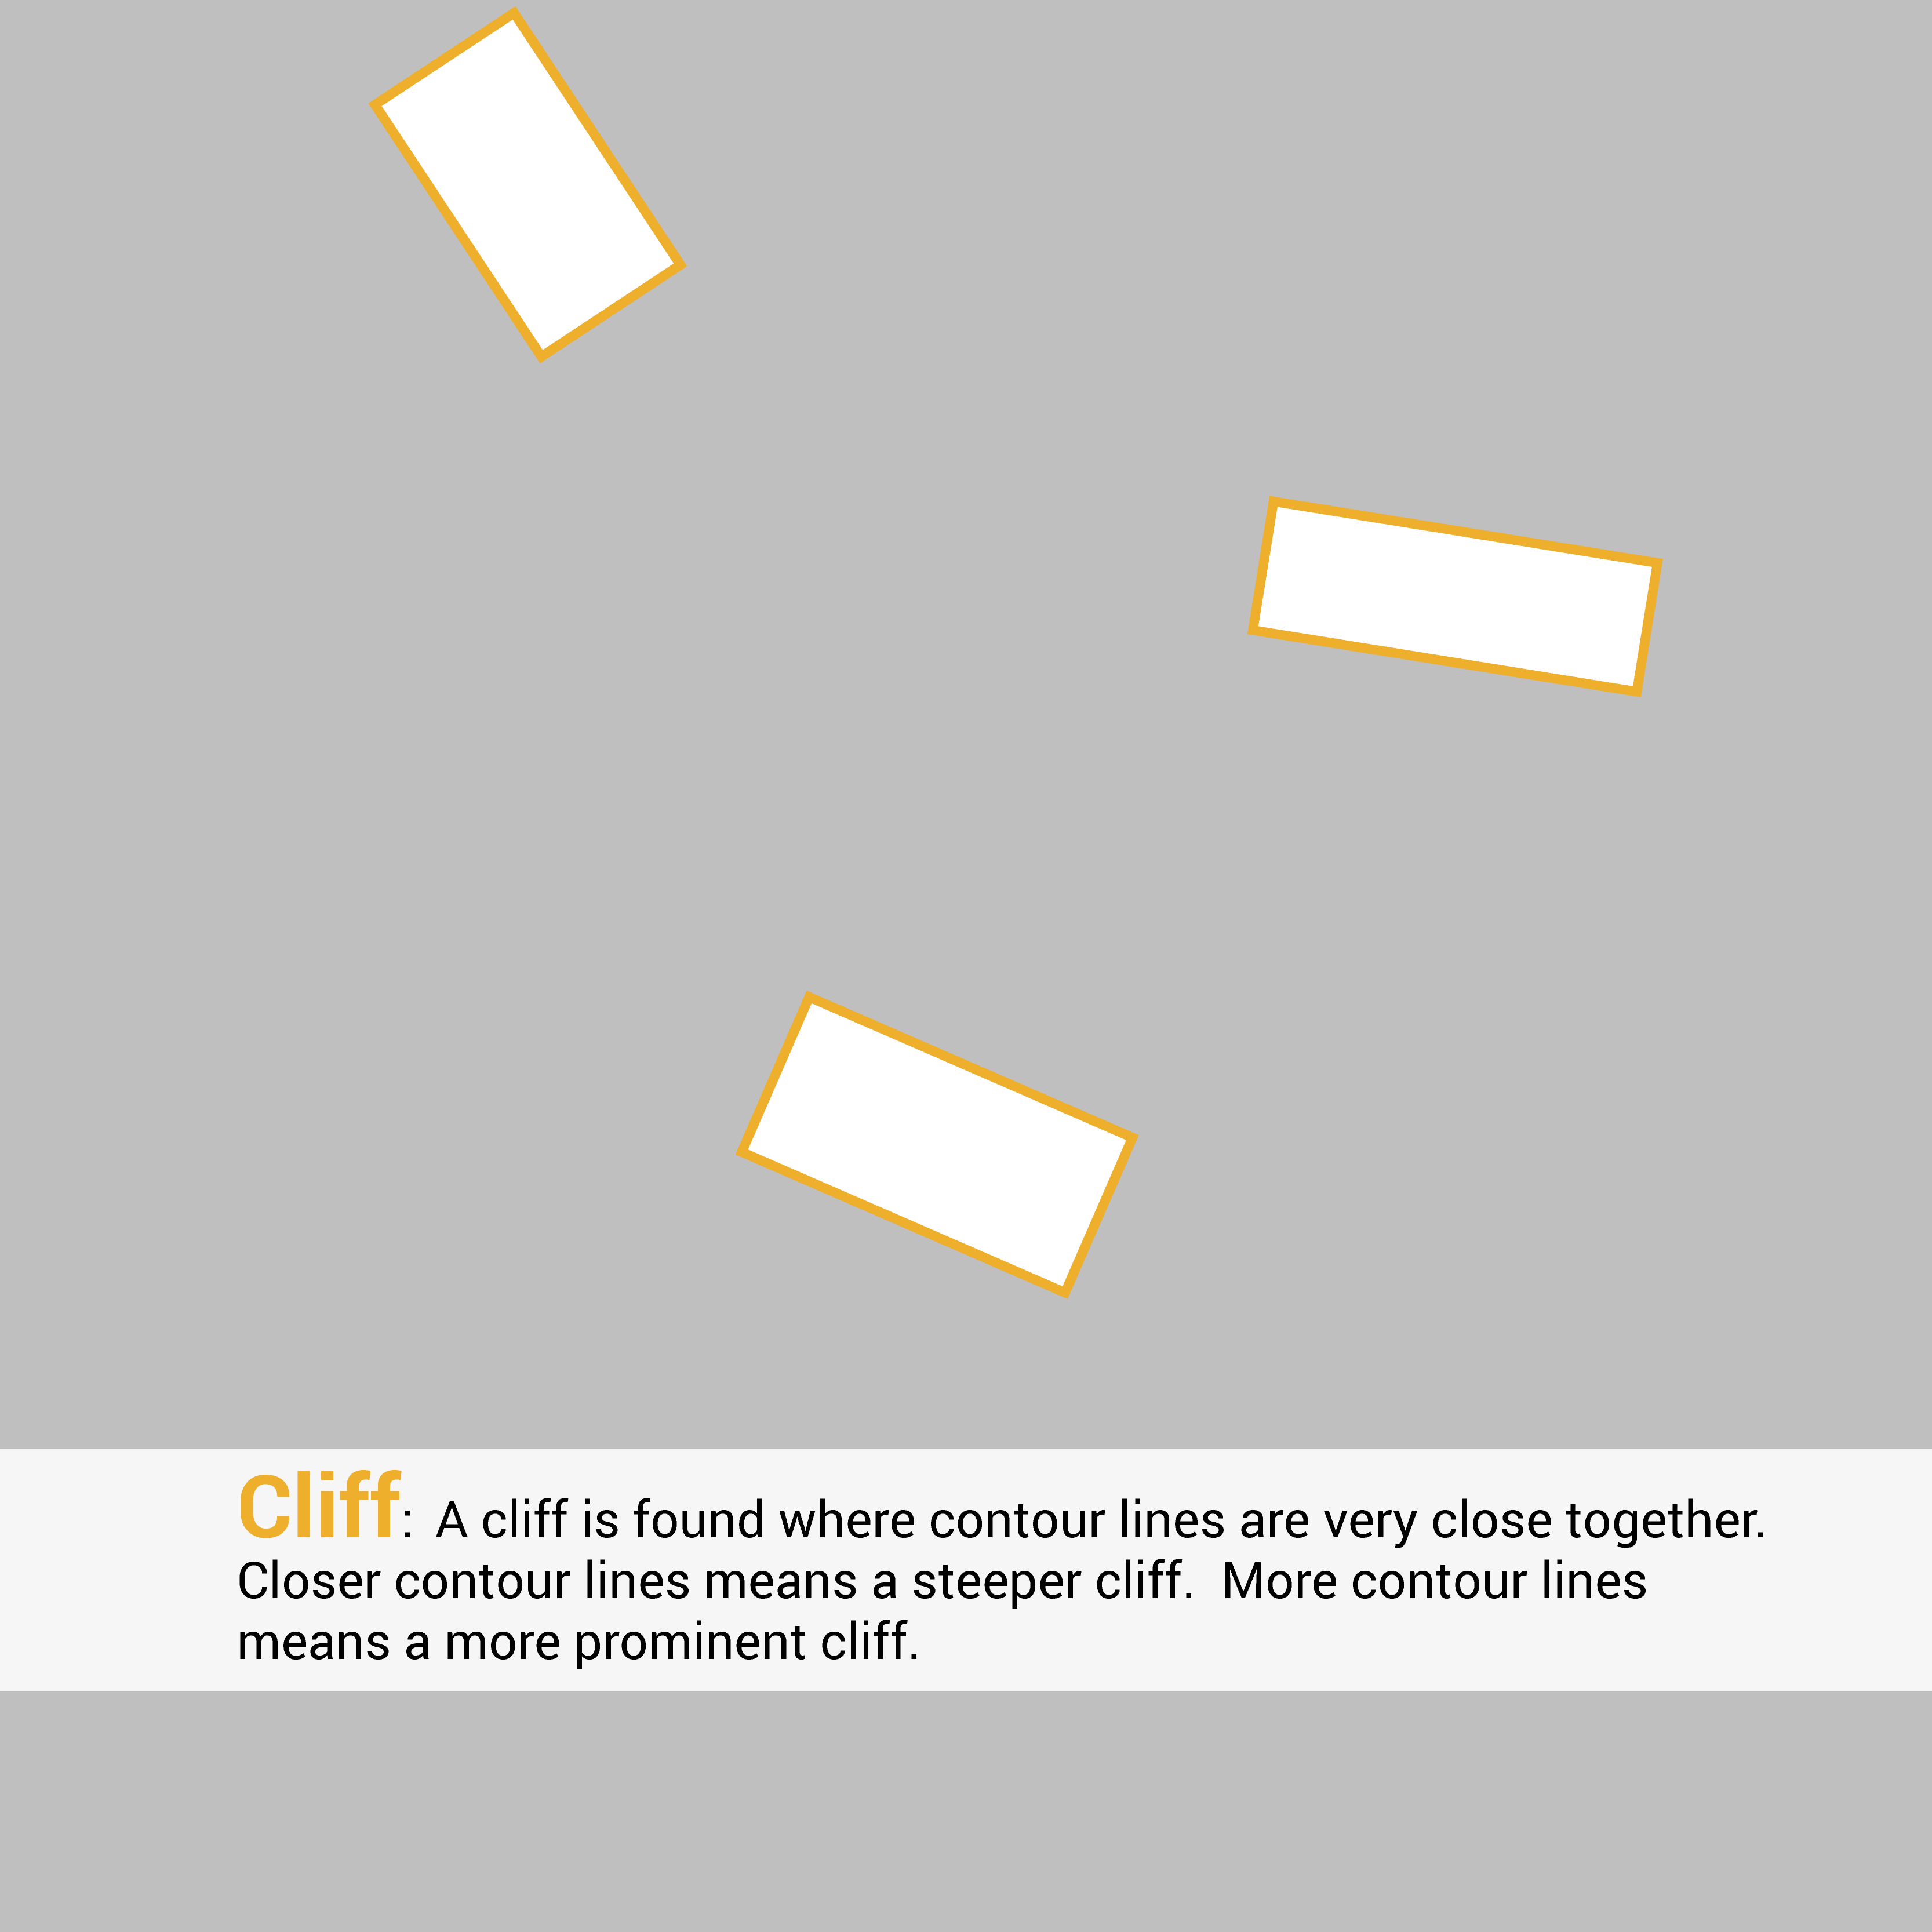
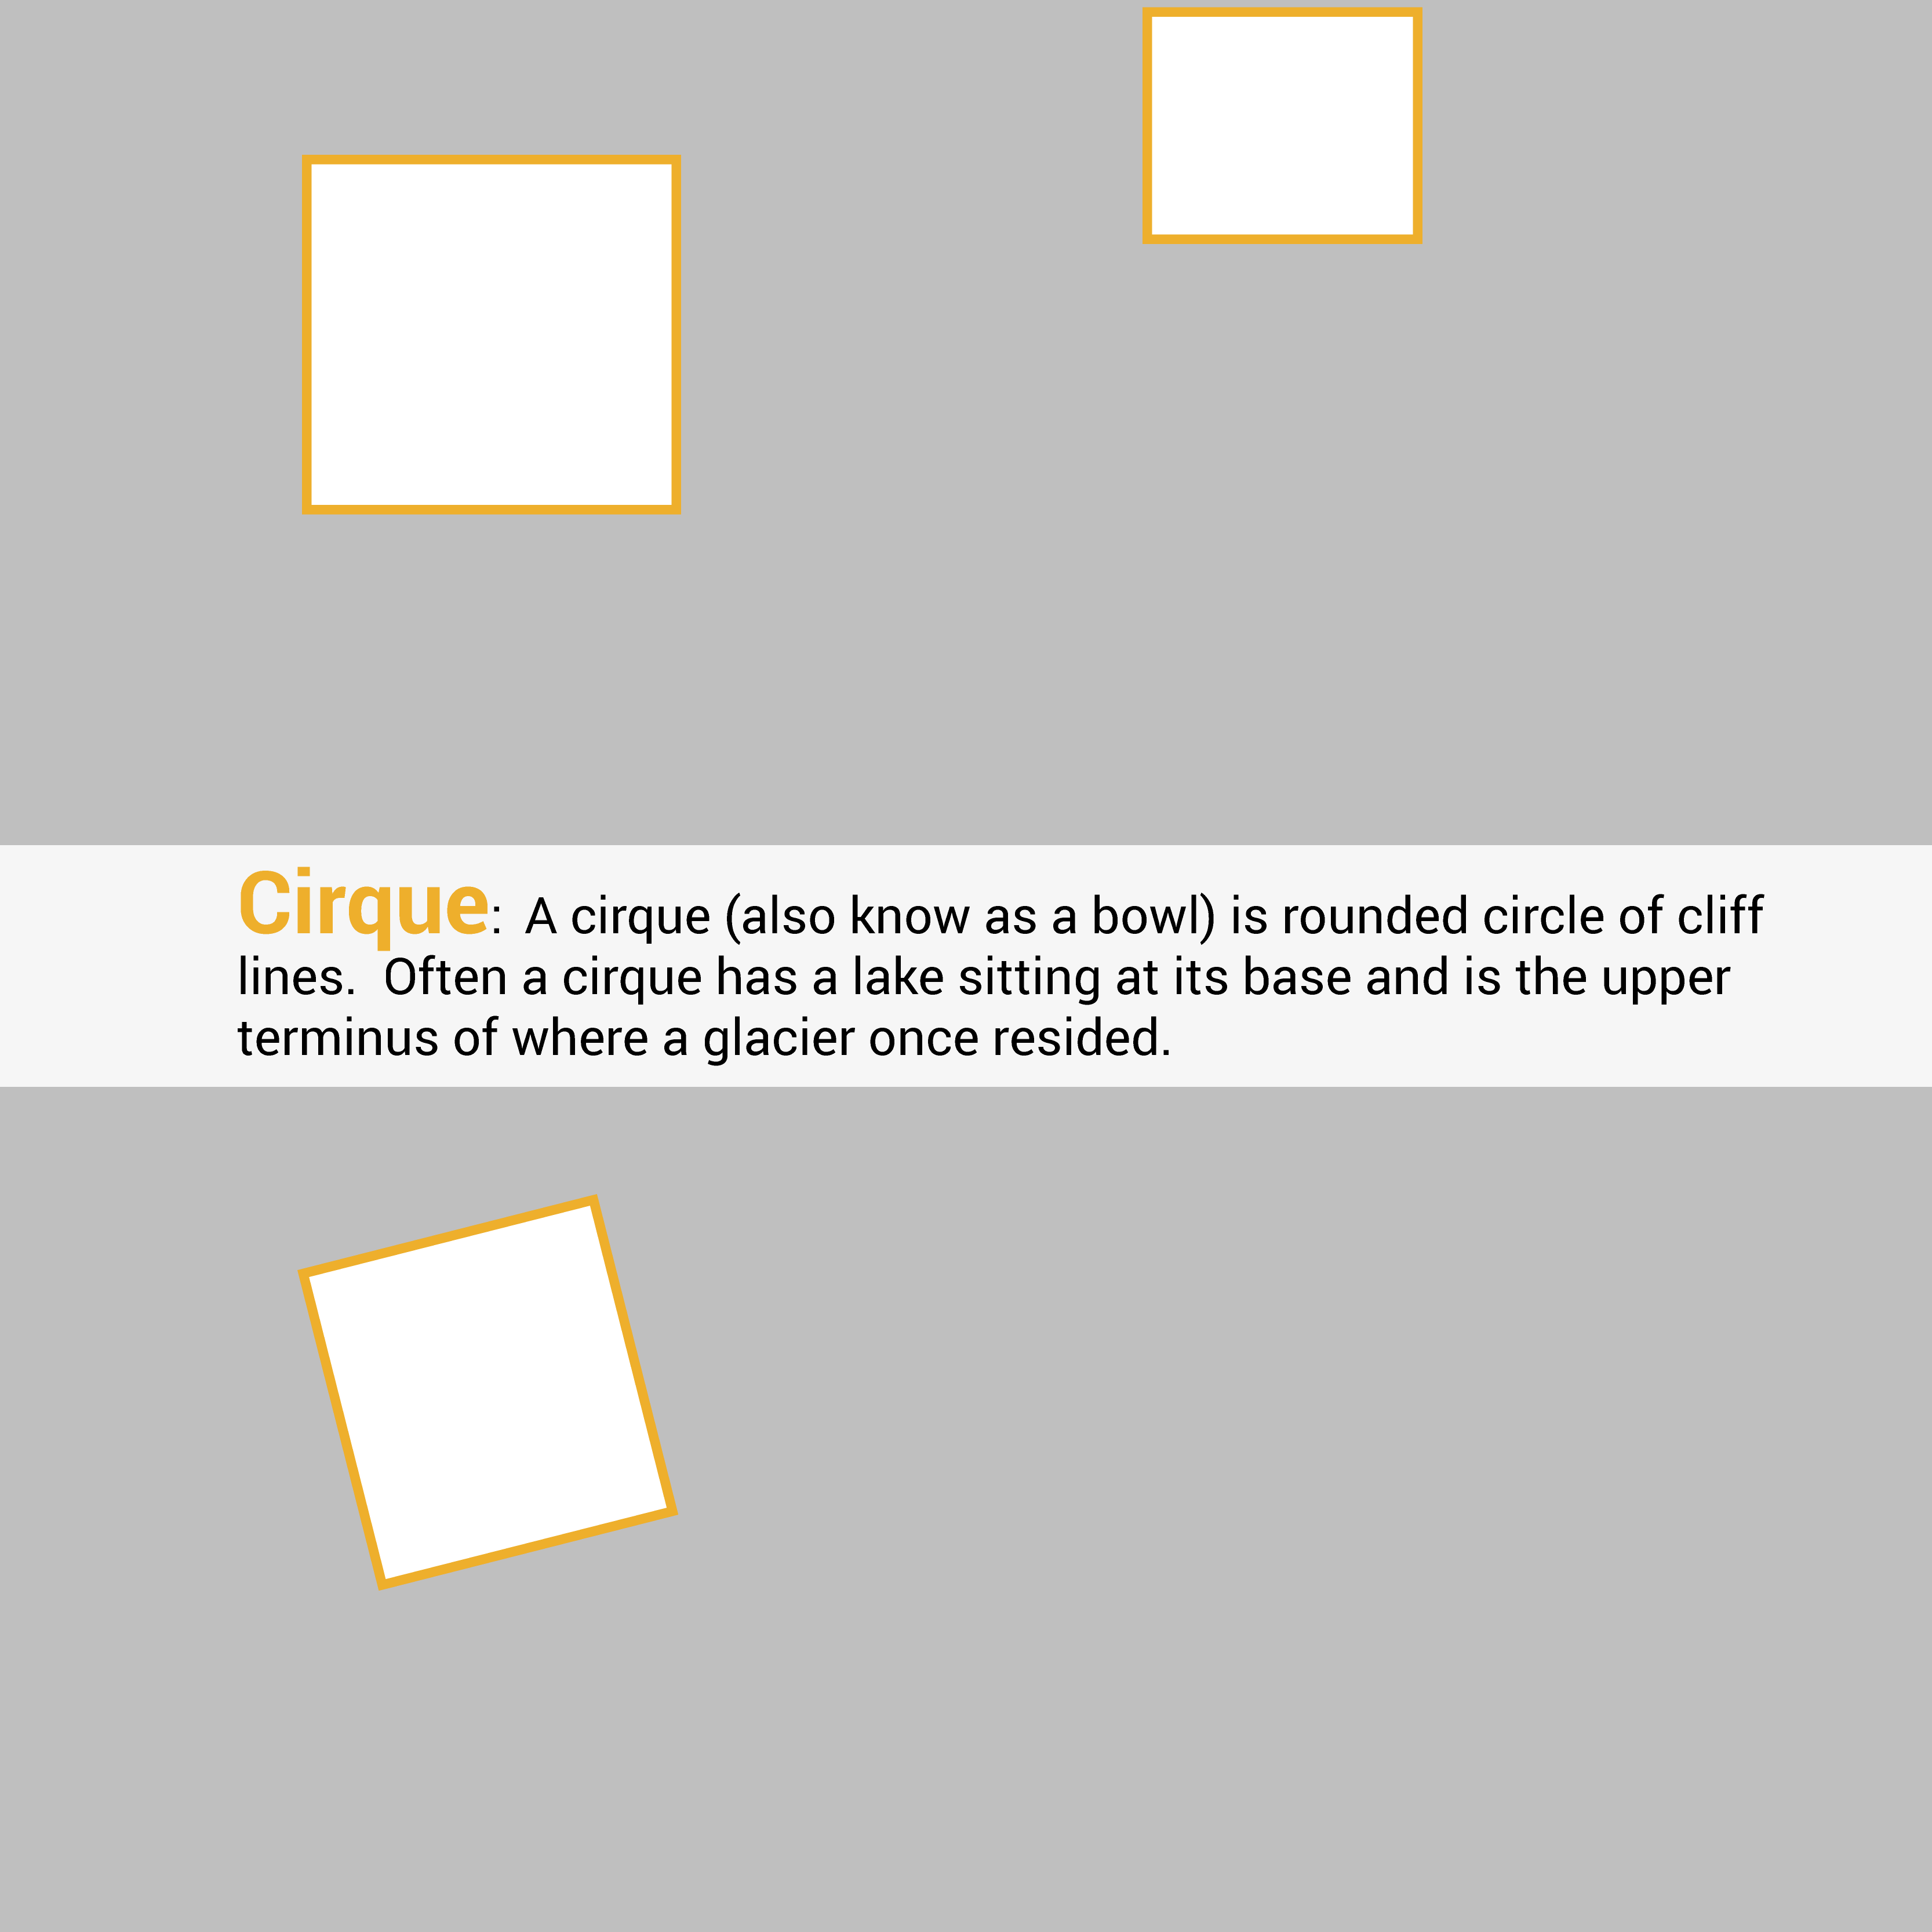
Understanding contour lines can be intimidating and tricky. To help clarify things, let's take a look at notable terrain features that are easily found on these maps.
Click on a terrain feature below for a description of how to locate them and to see some examples on the map.
If you are ever unsure whether a slope is going uphill or downhill, simply find the nearest index contour, read its elevation, and find an adjacent index contour to check which way the slope is directed.
Both the value and the difficulty of topographic maps come from the complexity of the information available on them. But with practice and preparation, you can have the tools to navigate confidently in any terrain.
The Beta:
-Download USGS maps by using their Map Locator Tool. Search or zoom to find the map you want, then select the "MARK POINTS" button and click to download the map files as a PDF. This is a great way to get good maps for free, you can laminate them or put them in a ziplock bag for added protection.